Minnesota minimum wage report 2022
By Gideon Ondieki, Hared Mah and Ender Kavas – December 2022
Contents
-
Actual minimum wages for Minnesota, Minneapolis and St. Paul
-
The minimum wage relative to hourly earnings in manufacturing
-
The minimum wage relative to hourly wages of nonfarm workers
Introduction and summary
With the introduction of municipal minimum wages in Minneapolis and St. Paul (all slated to reach $15.00 an hour at various points in the 2020s), the minimum wage in Minnesota has become a more nuanced issue. The effective minimum wage—the rate employers are required to pay to covered employees—is the highest of any applicable federal, state, or local rate. To understand minimum wages in Minnesota, one should compare the new municipal minimum wages with the federal and state minimum wage rates, how these rates have changed, and how they will change, relative to prices and other wages over time. This report presents data on these topics. Some of the data presented in the report should also be considered in the context of the post-COVID-19 labor market. Worker shortages and increased job mobility following the reopening of businesses, combined with high inflation, affected wages across many sectors of the economy in Minnesota.1
Data sources and methodology
The following list summarizes the data sources for this report.
-
The minimum wage data for Minnesota is from Minnesota Statutes § 177.24, subdivision 1, and the Minnesota Department of Labor and Industry (DLI). The Minnesota minimum wage historical data presented in several figures is from internal records at DLI (Minnesota's first minimum wage took effect Jan. 1, 1974).
-
The minimum wage data for Minneapolis is from the Minneapolis Code of Ordinances, Title 2, Chapter 40, and the City of Minneapolis Minimum Wage webpage.
-
The minimum wage data for St. Paul is from the St. Paul Legislative Code, Chapter 224.
-
Minimum-wage data for the United States is from the U.S. Department of Labor.
-
The 2021 poverty thresholds are from the U.S. Census Bureau and are adjusted to 2022 using a projection of the nationwide Consumer Price Index for All Urban Consumers (CPI-U), available from the U.S. Bureau of Labor Statistics.
-
The average hourly earnings of production workers in manufacturing are obtained from the Current Employment Statistics survey of the U.S. Bureau of Labor Statistics and the Minnesota Department of Employment and Economic Development (DEED).
-
The percentile wages for Minnesota nonfarm wage-and-salary workers are from the Occupational Employment Statistics survey of the U.S. Bureau of Labor Statistics.
Data in Figure 1 is adjusted for inflation as follows: The Minnesota minimum wages for small employers (annual revenue of less than $500,000) and large employers (annual revenue of $500,000 or more) are adjusted for inflation annually using the Implicit Price Deflator for Personal Consumption Expenditures produced by the U.S. Department of Commerce, Bureau of Economic Analysis, with new values effective Jan. 1 as provided by Minnesota statute. The minimum wages for Minneapolis large employers (more than 100 employees) and St. Paul macro employers (more than 10,000 employees) are adjusted for inflation annually beginning Jan. 1, 2023. Both Minneapolis and St. Paul ordinances provide that the respective city minimum wages shall be adjusted by the same adjustment used by DLI for the state minimum wage. (In both cities, the initial adjustment on Jan. 1, 2023, is half the adjustment calculated by DLI for the state minimum wage. The full adjustment will be applied in each subsequent year thereafter.)
The minimum wages for Minnesota large employers, Minneapolis small-employers (with 100 employees or less) and St. Paul small employers (between six and 100 employees) shown in Figures 3, 4, 6 and 7 are projected beyond 2022. The large-employer minimum wage for Minnesota is projected for 2023 to 2028, while the small-employer minimum wage for Minneapolis is projected for 2024 to 2028, and the small-employer minimum wage for St. Paul is projected for 2026 to 2028. The Implicit Price Deflator for Personal Consumption Expenditure is used for these projections. Moreover, the minimum wages of different years are expressed in 2022 constant dollars using the CPI-U for the Minneapolis-St. Paul metropolitan area, available from the U.S. Bureau of Labor Statistics. The values for 2022 to 2028 are projected from earlier years. The minimum wage used for each year is the rate in effect as of Dec. 31 of that year.
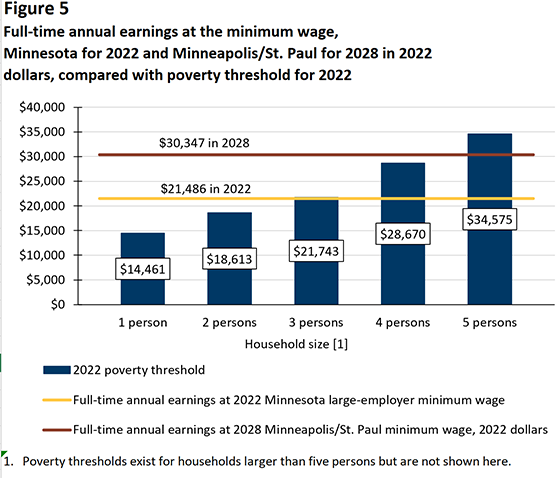
The 2021 poverty thresholds in Figure 5 are adjusted to 2022 using a projection of the nationwide CPI-U. Full-time annual earnings at the 2022 Minnesota large-employer minimum wage were computed by multiplying the inflation-adjusted minimum wage of $10.33 by an annual hours figure of 2,080. Projected full-time annual earnings at the 2028 Minneapolis and St. Paul minimum wages were computed as follows: The minimum wage for 2028 was projected as $16.81 using the provisions of the Minneapolis and St. Paul ordinances, along with a projection of the Implicit Price Deflator for Personal Consumption Expenditures. This minimum wage then was adjusted to 2022 dollars using a projection of the CPI-U for the Minneapolis-St. Paul metropolitan area for 2022 to 2028. This value in 2022 dollars was $14.59, which was then multiplied by 2,080 hours to derive the equivalent full-time annual earnings figure.
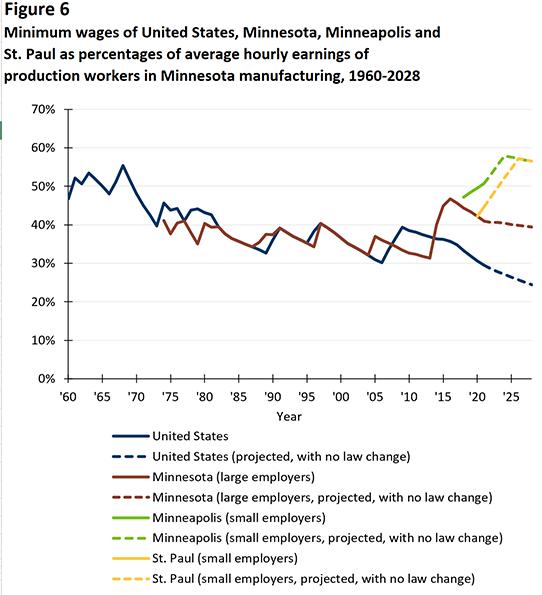
In Figure 6, a three-year moving average of hourly earnings of production workers in manufacturing is used. Because this data is only available starting in 1970 for Minnesota, the data was projected for 1960 through 1969 using the trend in average hourly earnings of production workers in manufacturing for the U.S.
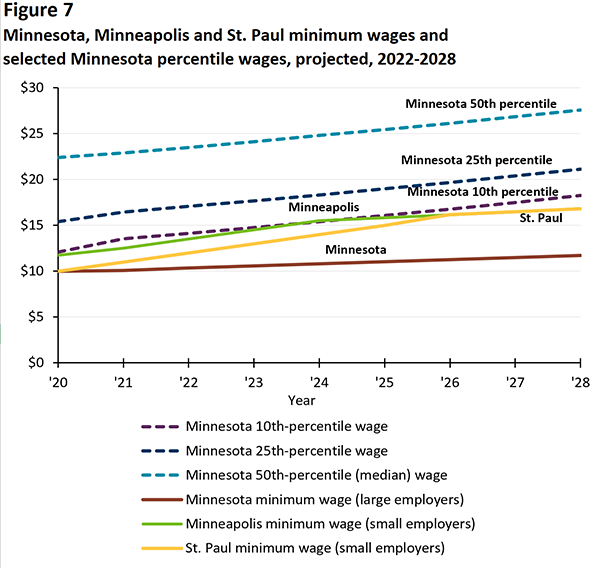
In Figure 7, the percentile wages for Minnesota nonfarm wage-and-salary workers are projected for 2022 through 2028. The Minnesota large-employer minimum wage is projected for 2024 to 2028, while the Minneapolis small-employer minimum wage is projected for 2024 to 2028, and the St. Paul small-employer minimum wage is projected for 2026 to 2028, using the methodology described earlier in this section.
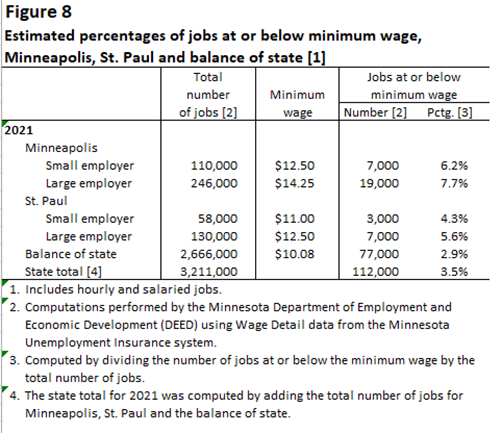
In Figure 8, computations for the number and percentage of jobs at or below the minimum wage for Minneapolis, St. Paul and the balance of the state were performed by DEED according to specifications from DLI. DEED uses the Wage Detail database of the Minnesota Unemployment Insurance System for these computations. For Minneapolis and St. Paul, the estimates are broken down by small and large employers. For 2021, DEED refined its estimation approach to determine employer size based on the cities’ definition of small and large employers. Rather than determining employer size based solely on the number of employees per location, DEED’s approach defines employer size at the level of the parent firm and includes a special categorization for full-service restaurants. However, DEED does not code firms based on franchise status. Both cities treat franchises as large employers if they meet certain requirements. In addition, there was a small number of businesses in each city that could not be classified by size. Although it is difficult to precisely capture employer size, DLI believes the estimates are close to the actual numbers in each size class in both cities.
Findings
The following is a summary of findings.
-
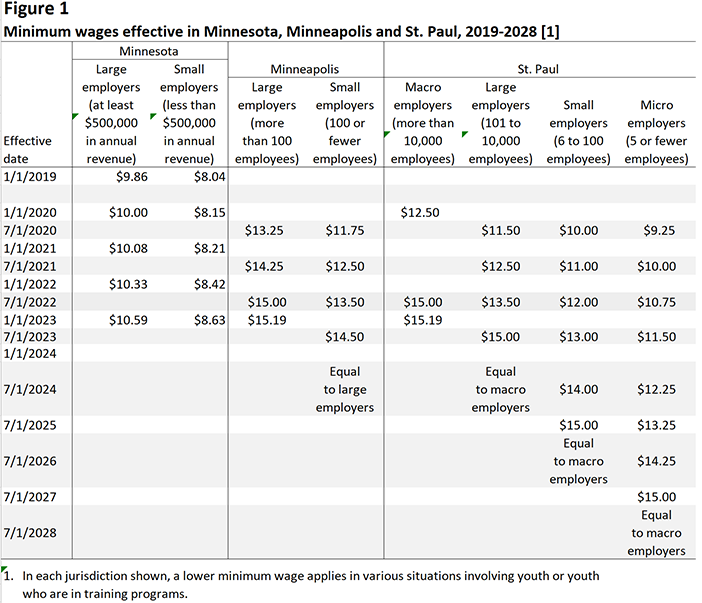
Actual minimum wages for Minnesota, Minneapolis and St. Paul – The Minnesota minimum wage – $10.33 an hour for large employers in 2022 – is adjusted annually for inflation. The minimum wages for large employers in Minneapolis and macro employers in St. Paul reached $15 in 2022. Minimum wages for other employers of different sizes in Minneapolis and St. Paul will reach $15 in various years from 2023 to 2027, and will be adjusted for inflation thereafter (Figure 1).
-
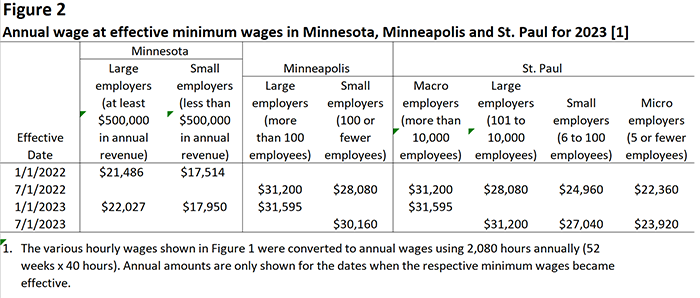
Actual annual earnings at the minimum wage – For workers earning the Minnesota minimum hourly wage and working 40 hours a week, annual wages in 2022 are $21,486 for workers at large employers and $17,514 for workers at small employers. As of July 1, 2022, workers in Minneapolis earn annual full-time wages of $31,200 at large employers and $28,080 at small employers, while St. Paul workers earn $28,080 at large employers and $24,960 at small employers (Figure 2).
-
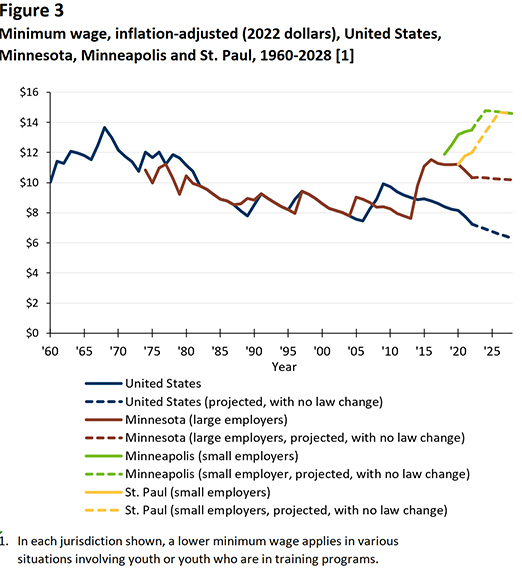
Inflation-adjusted minimum wages – Adjusting for inflation, the 2022 Minnesota large-employer minimum wage of $10.33 an hour is below the average rate of the federal minimum wage for 1960 through 1981, which was $11.71. When the Minneapolis and St. Paul minimum wages reach $15, they will be higher, adjusting for inflation, than the $13.65 peak reached by the federal minimum wage in 1968 (Figure 3).
-
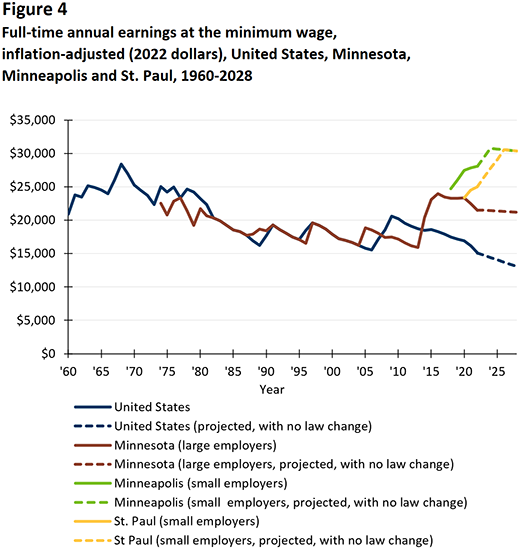
Inflation-adjusted annual earnings at the minimum wage – At the 2022 Minnesota large-employer minimum wage of $10.33, a full-time worker would earn about $21,486 annually. After the transition periods, full-time annual earnings at the small-employer minimum wages will reach $30,757 in Minneapolis in 2024, and $30,553 in St. Paul in 2026, in 2022 dollars (Figure 4).
-
The minimum wage relative to the poverty line – At the Minnesota large-employer minimum wage, full-time annual earnings are above the poverty thresholds for one-person and two-person households, and slightly less than the poverty threshold for a three-person household. At the Minneapolis and St. Paul minimum wages for 2028, full-time annual earnings will fall about midway between the poverty thresholds for households of four and five persons (Figure 5).
-
The minimum wage relative to hourly earnings in manufacturing – Relative to average hourly earnings (AHE) of production workers in Minnesota manufacturing, the federal minimum wage peaked at 55% in 1968. After the transition periods in Minneapolis and St. Paul, the $15 minimum wages in the two cities will stand at roughly 58% and 55% of manufacturing AHE, respectively (Figure 6).
-
The minimum wage relative to hourly wages of nonfarm workers – The 2022 Minnesota large-employer minimum wage of $10.33, as adjusted for inflation in future years, is running at less than the 10th percentile of hourly wages of nonfarm wage-and-salary workers in Minnesota. After the transition periods in Minneapolis and St. Paul, the minimum wages in those cities are expected to remain at or below the 10th percentile of overall nonfarm wages in the state. Due to the increase of minimum wage in Minneapolis and St. Paul, the 10th percentile will have an upward trajectory (Figure 7).
-
The percentage of jobs at or below the minimum wage – In 2021, the estimated number of Minnesota jobs paying at or below the minimum wage was around 112,000, or 3.5% of salaried and hourly jobs. The percentage of jobs estimated to be at or below the minimum wage was 6.2% among small employers and 7.7% among large employers in Minneapolis, and 4.3% among small employers and 5.6% among large employers in St. Paul.
Actual minimum wages for Minnesota, Minneapolis and St. Paul
Figure 1 shows the minimum wage rates effective in Minnesota and the cities of Minneapolis and St. Paul for 2019 to 2028. As of Jan. 1, 2022, the Minnesota minimum wage is $10.33 for large employers (see figure for employer size definitions) and $8.42 for small employers. On Jan. 1, 2023, the Minnesota minimum wage will be adjusted for inflation, increasing to $10.59 for large employers and $8.63 for small employers.2
Under the Minneapolis and St. Paul minimum wage ordinances, the minimum wages in the two cities will reach $15 under different timelines depending on employer size. The Minneapolis minimum wage for large employers reached $15 on July 1, 2022, and adjusted for inflation, will increase to $15.19 on Jan. 1, 2023. The Minneapolis minimum wage for small employers has a more delayed phase-in, but will reach the same rate as large employers on July 1, 2024.
The St. Paul minimum wage took effect in 2020. Minimum wage for macro employers reached $15 on July 1, 2022, and adjusted for inflation, will increase to $15.19 on Jan. 1, 2023. Large (non-macro) employers will reach the $15 rate on July 1, 2023; small and micro employers will reach $15 in 2025 and 2027, respectively. All employers will reach the same rate as macro employers (an indexed $15 minimum) by 2028. Given the provisions of the minimum-wage ordinances in Minneapolis and St. Paul, employers of all sizes in the two cities will pay the same indexed minimum wage as of July 1, 2028.3
Actual annual earnings at the minimum wage
For workers earning the Minnesota minimum hourly wage and working 40 hours a week, annual wages as of Jan. 1, 2022, are $21,486 for workers at large employers and $17,514 for workers at small employers. Effective Jan. 1, 2023, annual wages will be $22,027 for large employers and $17,950 for small employers (Figure 2).
As of July 1, 2022, workers in Minneapolis earn annual full-time wages of $31,200 at large employers and $28,080 at small employers, while St. Paul workers earn $28,080 at large employers and $24,960 at small employers. Effective Jan. 1, 2023, workers in Minneapolis will earn annual full-time wages of $31,595 at large employers. Effective July 1, 2023, Minneapolis workers will earn annual full-time wages of $30,160 at small employers, while St. Paul workers will earn $31,200 at large employers and $27,040 at small employers.
Inflation-adjusted minimum wages
Figure 3 shows the minimum wages for the United States, Minnesota, Minneapolis and St. Paul for 1960 to 2028, adjusted for inflation (in 2022 dollars). In 2022 dollars, the federal minimum wage reached a peak of $13.65 an hour in 1968.4 The current federal minimum wage of $7.25 (its rate since 2009) is not indexed for inflation. Therefore, in 2022 dollars, the value of the federal minimum wage is projected to decline to $6.29 by 2028 in the absence of any statutory increases.
In 2022 dollars, the current large-employer Minnesota minimum wage of $10.33 is higher than the United States and Minnesota rates of any year from 1982 through 2014, and below the average rate of the federal minimum wage for 1960 through 1981, which was $11.71. Although the state minimum wage is currently indexed for inflation, the constant-dollar value of the state minimum wage is projected to decrease slightly through 2028. This is because the Implicit Price Deflator for Personal Consumption Expenditures, which is used under statute to index the state minimum wage, is projected to increase less rapidly than the index used in Figure 3 to express the trends in constant-dollar terms, the CPI-U.
The minimum wages shown in Figure 3 for Minneapolis and St. Paul are the small-employer minimum wages. This is because, in contrast to the provision for the state minimum wage, the small-employer categories for the Minneapolis and St. Paul minimum wages include employers with up to 100 employees. In 2022 dollars, the Minneapolis and St. Paul small-employer minimum wages are projected at $14.59 an hour for 2028. These values, which are adjusted for projected inflation between 2022 and 2028, are $0.94 an hour higher than the inflation-adjusted peak value of $13.65 reached by the federal minimum wage in 1968. As noted above, after the initial transition period, employers of all sizes in the two cities will have the same minimum wage.
As with the state minimum wage, the constant-dollar values of the Minneapolis and St. Paul minimum wages are projected to decrease slightly over time after inflation-indexing has begun (after 2024 and 2026, respectively, for the small-employer minimum wages in the two cities). As with the state minimum wage, the reason for the decrease is because the Implicit Price Deflator for Personal Consumption Expenditures is projected to increase less rapidly than the CPI-U.
Inflation-adjusted annual earnings at the minimum wage
Figure 4 shows full-time annual earnings at the minimum wages for the United States, Minnesota, Minneapolis and St. Paul for 1960 to 2028, adjusted for inflation (in 2022 dollars). This figure uses the same underlying data as Figure 3, but the inflation-adjusted minimum wage was translated to inflation-adjusted full-time annual earnings using an annual hours figure of 2,080.
Where the federal and state minimum wages are concerned, inflation-adjusted full-time annual earnings reached a peak of $28,393 in 1968 at the federal minimum wage. At the state minimum wage (for large employers), full-time inflation-adjusted annual earnings are currently $21,486. At the small-employer minimum wages in Minneapolis and St. Paul, full-time annual earnings, in 2022 dollars, are projected to reach $30,757 in Minneapolis in 2024 and $30,553 in St. Paul in 2026.5
The minimum wage relative to poverty thresholds
Figure 5 compares minimum-wage earnings to estimated poverty thresholds (projected to 2022) for households of different sizes. At the Minnesota large-employer minimum wage for 2022, full-time annual earnings – $21,486 in 2022 dollars – were above the poverty thresholds for one-person and two-person households, and slightly less than the poverty threshold for a three-person household. At the 2028 minimum wage for Minneapolis and St. Paul, full-time annual earnings are projected to be about midway between the poverty thresholds for four-person and five-person households when adjusted to 2022 dollars.6
The minimum wage relative to hourly earnings in manufacturing
It is also relevant to gauge the rate of the minimum wage relative to other wages. Figure 6 expresses the minimum wages of the United States, Minnesota, Minneapolis and St. Paul as percentages of average hourly earnings (AHE) of production workers in Minnesota manufacturing for 1960 to 2028.7
As a percentage of manufacturing AHE, the federal minimum wage reached a peak of roughly 55% in 1968. The Minnesota minimum wage for large employers has been less than that level for its entire history. At its current rate, the Minnesota minimum wage of $10.33 is about 41% of manufacturing AHE, which is projected to be around $25 in 2022.
As to the Minneapolis and St. Paul minimum wages for small employers, a pattern arises similar to those in Figures 3 and 4. The initial rates of these minimum wages ($10.25 in Minneapolis for 2018 and $10 in St. Paul for 2020) were less than 50% of manufacturing AHE. However, by the time the Minneapolis and St. Paul minimums reach $15, they will be about 58% and 55% of manufacturing AHE, respectively. Both will be above the 55% level reached by the federal minimum wage in 1968.
The minimum wage relative to hourly wages of nonfarm workers
Figure 7 gives another perspective on minimum wages relative to other wages in Minnesota. It shows the minimum wages for Minnesota, Minneapolis and St. Paul against different percentile hourly wages for Minnesota nonfarm wage-and-salary workers for 2022 to 2028.
For the entire period shown, the Minnesota large-employer minimum wage is less than the 10th-percentile wage of Minnesota nonfarm wage-and-salary workers. The Minneapolis and St. Paul small-employer minimum wages begin at rates below the 10th percentile and then rise, but remain at or below the 10th percentile of overall nonfarm wages in the state.8 For instance, by 2026, the Minneapolis and St. Paul small employer wages are projected to reach $16.14, which will be slightly below the 10th percentile wage of $16.76 for Minnesota nonfarm wage-and-salary workers.
The percentage of jobs at or below the minimum wage
Another approach for analyzing minimum wage is considering the percentage of jobs that pay the minimum wage or less. Figure 8 shows the number and percentage of jobs at or below the minimum wage for Minneapolis, St. Paul and the balance of the state for 2021.
The estimates for Minneapolis and St. Paul are disaggregated by employer size and shown separately for small and large employers.9 In 2021, the percentage of jobs estimated to be at or below the minimum wage was 6.2% for small employers and 7.7% for large employers in Minneapolis, and 4.3% for small employers and 5.6% for large employers in St. Paul. For the balance of the state, the percentage of jobs at or below the state minimum wage was approximately 2.9%. Combining the estimates for all three areas shows an estimated 112,000 out of 3,211,000, or 3.5%, of salaried and hourly jobs were at or below a given minimum wage in the state of Minnesota in 2021.10
In reports published prior to the pandemic, the numbers of jobs at or below the minimum wage were projected for future years. However, because of the effects of the pandemic on the economy in 2020 and 2021 and the recent effect of inflation on wages, it was not possible to reliably project these numbers for future years. The statistics provided above should be interpreted in the context of the post-COVID-19 labor market. Worker shortages and increased job mobility following the reopening of businesses led to the general rise of wages across many sectors of the economy in Minnesota. However, wage growth might not continue into the future as it is already slowing down in 2022.
Data limitations regarding Figure 8
One issue with the Wage Detail data, from which these estimates are derived, concerns the computation of hourly wages for individual jobs. The hourly wage is computed by calendar quarter as earnings for the quarter divided by hours worked for the quarter, both reported by the employer. An examination of the data reveals that hours worked are often underreported – in many cases apparently, because the employer mistakenly reports weekly hours rather than quarterly hours. To the degree this occurs, hourly wages are overstated, so the number and percentage of workers at or below the minimum wage (or any wage threshold) are understated. The degree of understatement is unknown.
Moreover, precise calculation of employer size is not possible because DEED does not code firms based on franchise status. This is important because both Minneapolis and St. Paul classify franchise businesses as large employers under certain conditions. Although DEED’s estimation does partially account for franchise businesses, not being able to identify them directly might overestimate the number of small employers in both cities. Nevertheless, estimates of jobs at or below minimum wage are provided in Figure 8.
Endnotes
1See "Wages and inflation in Minnesota" at mn.gov/deed/newscenter/publications/trends/june-2022/wages.jsp and "Job mobility in the post-COVID labor market" at mn.gov/deed/newscenter/publications/trends/september-2022/mobility.jsp for a discussion about how wages were affected by changes in the post-COVID-19 labor market.
2Note the definition of "small employer" is different for Minnesota than for either Minneapolis or St. Paul. For Minnesota, small employers are those with less than $500,000 in annual revenue. For Minneapolis and St. Paul, small employers are those with 100 or fewer employees (and more than five employees for St. Paul). According to data from the U.S. Small Business Administration, businesses in 2012 with one to four employees had an average of $406,000 in annual revenues. Extrapolating from this, a business with five employees would have an average of more than $406,000 in annual revenues. Thus, the $500,000 dividing line between "small" and "large" for Minnesota is at the lower end of "small" for Minneapolis or St. Paul (and near the line between "small" and "micro" for St. Paul). In other words, many employers that would be "large" for Minnesota would be "small" for Minneapolis or St. Paul.
3The provisions at issue are: (1) the large-employer minimum wage in Minneapolis and the macro-employer minimum wage in St. Paul will both reach $15 on July 1, 2022; (2) the provisions for inflation-indexing are the same in the two cities; and (3) the minimum wages for all employers in the two cities will eventually reach the large-employer rate in Minneapolis and the macro-employer rate in St. Paul.
4This report uses the expression "adjusted for inflation" to refer to the statistical adjustment of the minimum-wage amounts for different years to express them in constant 2022 dollars to analyze how they have changed, and will change, over time in purchasing-power terms. This adjustment uses the Consumer Price Index for the Minneapolis-St. Paul Metropolitan Area. This is different from the indexing of the Minnesota, Minneapolis and St. Paul minimum wages under statute and ordinance, which generally increases them each year (or will increase them each year when this provision becomes effective for Minneapolis and St. Paul). This indexing uses the nationwide Implicit Price Deflator for Personal Consumption Expenditures.
5As in Figure 3, there is a slight downward drift in the constant-dollar values of the Minnesota minimum wage after 2020 and of the Minneapolis and St. Paul minimum wages when inflation-indexing has begun for them. As in Figure 3, the reason is that the index used to increase the state and city minimums is projected to increase less rapidly than the index used to express the trends in constant-dollar terms.
6The comparison would be the same if the poverty thresholds and earnings amounts were expressed in 2028 dollars.
7Manufacturing is used because it is the only industry for which historical data for this time period is available. It would be preferable to use a broader wage measure, ideally the average or median wage of the overall state economy, as the basis for comparison, but such a measure is not available for the period concerned.
8The minimum wage increases in Minneapolis and St. Paul will raise the lower portion of the wage distribution and the Minnesota 10th percentile wage.
9Computations were performed by DEED according to specifications from DLI, using Wage Detail data from the Minnesota Unemployment Insurance system. The approach used by DEED to estimate employer size for 2021 is based on the method used by Minneapolis and St. Paul as defined by their city minimum-wage ordinances. DEED's approach defines employer size at the level of the parent firm and includes a special categorization for full-service restaurants. However, it does not capture businesses that operate as franchises.
10Total number of jobs for Minnesota in 2021 was reported as around 2,760,000 in the Quarterly Census of Employment and Wages (QCEW), which is lower than the 3,211,000 jobs reported in the Wage Detail data from the Unemployment Insurance system. This difference stems from the way jobs are measured in the two systems: QCEW measures jobs at a point in time (the week of the 12th of each of the three months in the quarter), whereas the Unemployment Insurance Wage Detail data measures all jobs that were held throughout the quarter. For example, a job held by two different individuals at two different months in the quarter would be counted twice in Wage Detail data but only once in QCEW.

